

What is a Candlestick?
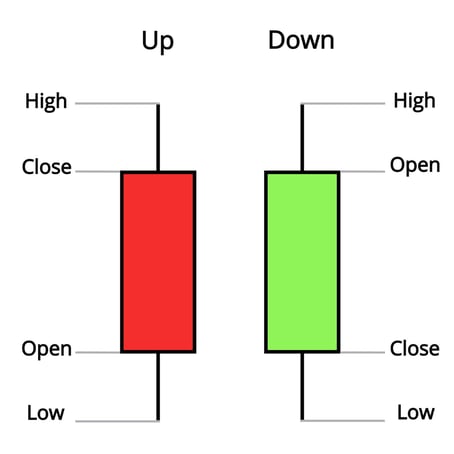
A candle is a visual display of the opening price, and closing price, as well as the high and low for a certain period. The interval between the opening and closing prices of the candlestick is coloured red or green. If the closing price is higher than the opening price, the candle is green; if the close is lower than the open, the candle is red.
Candles also have their own classification. They are divided into three large groups:
- Large candles have massive bodies.
- Spinning tops and paper umbrellas have an insignificant bodies.
- Doji. This type of candle is distinguished by a very small, almost absent body or does without it at all. This happens when the opening price is equal to the closing price.
Large candlestick
When we see a large candlestick, we logically understand that the closing price has gone very far from the opening price, which means that there is a strong movement in the market. And the market has the necessary forces in order to go in the chosen direction. As for the shadows, the smaller they are, the better.
Spinning tops and paper umbrellas.
There are many forms and modifications in this category. This is a small body and a shadow, or shadows.
Doji.
This type of Japanese candlestick indicates that the market is in turmoil as the closing price is close to or equal to the opening price. The market opened, made some moves up and down, and then returned to the starting point.
In order to understand how exactly to analyze the candlesticks, it is required to know the 5 key rules of their analysis.
Rule 1
The size, colour and pattern of the candlestick should be evaluated only after the candlestick is closed. We cannot judge what candlestick is now in front of us until it is closed, because the situation in the market can change in a matter of seconds.
Rule 2
Candlestick size should be subjectively assessed by the trader, based on the current market volatility. On one asset and timeframe, the 30 (thirty) points candlestick will be a large one, and for another, it is required for the price to pass at least 50 (fifty) points in order to gain value.
Rule 3
Reversal candlestick configurations are considered at the top or at the bottom of the market. We have already mentioned that candlestick configurations hold only at the bottom or at the top of the market, as well as near significant levels.
Rule 4
The older the timeframe, the more reliable the signal of candlestick patterns is. For example, the candlesticks in four-hour periods are strong and make more reliable signals, than one hour.
Rule 5
Reversal candlestick patterns indicate the price reversal and do not indicate what distance the price chart will cover.
The candlestick configurations
In candlestick analysis it's quite simple, configurations are divided into
- One-candle
- Two-candle
- Three-candle configurations.
Here are a few examples of these configurations

Оцените изложенный материал