

Except for levels and lines, chart patterns can be singled out in the market. They also help us to define the positions opening and to set the profit-taking goals.
There are three types of chart patterns.
- Reversal patterns
- Trend continuation patterns
- Bidirectional patterns. That is they can indicate either trend reversal or continuation
Reversal patterns
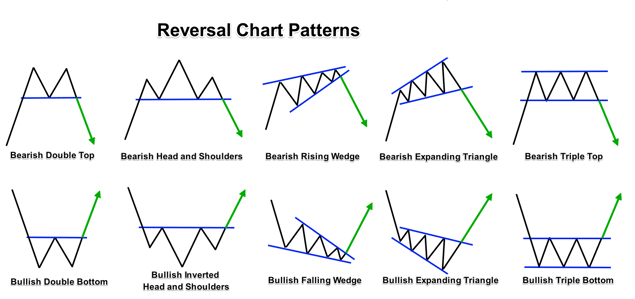
The Head &Shoulders
The Head &Shoulders pattern is a very unique reversal pattern. It’s a chart formation created by three peaks of the price. The two peaks on the sides are usually of the same height or close, and the one in the middle is the highest.
The Head & Shoulders pattern is considered one of the most powerful reversal patterns in the forex market. This pattern got the name because it actually reminds us of a head with two shoulders on the sides. Usually, we will look for this pattern and use it after a significant uptrend or an opposite Head & Shoulders after a downtrend.
In a bullish trend, the price creates atop – it will be the left shoulder. Then, after technical correction, the price creates a higher top – that will be the head. Now the price will form a deep technical correction to the same level as the last low.
And lastly, the price creates a lower high, which is the right shoulder. The line that connects all the three bottoms of the three peaks is called the Neckline. The confirmation of the pattern comes after the price breaks the Neckline. The moment the price breaks, the Neckline is considered to be a reversal signal, and that’s the time to look for a sell position or to look for a buy position in the opposite Head & Shoulders after a downtrend.
Continuation Patterns
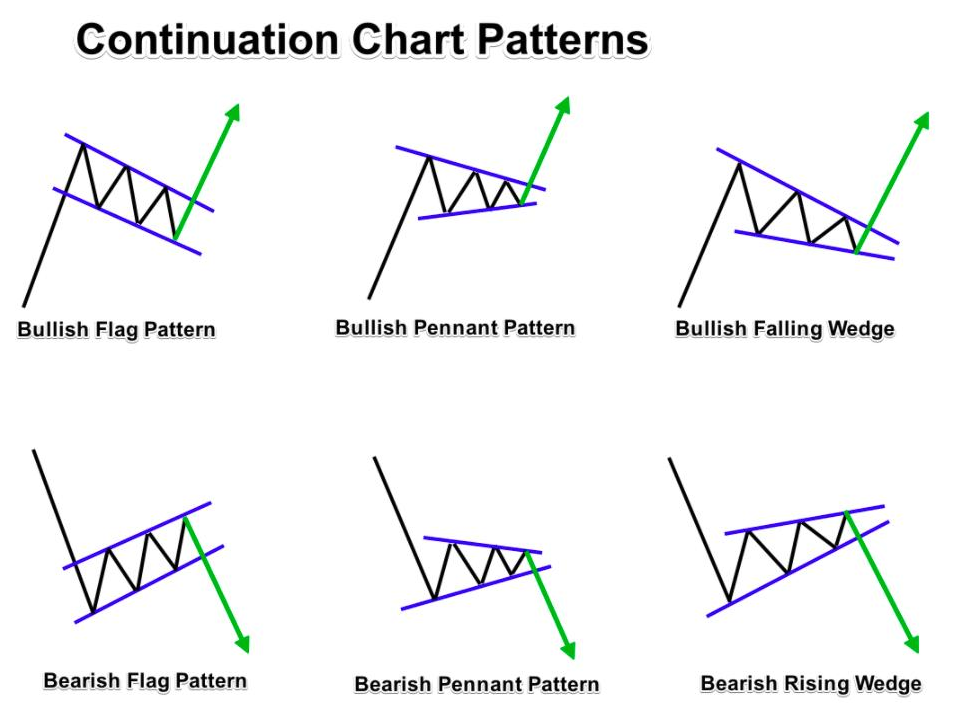
Continuation patterns in technical analysis are, as the name suggests, chart patterns that show that an asset’s price trend will continue once the pattern has finished. Thus, continuation patterns are understood as a pause in an asset’s trend; a period of consolidation, or price acceptance, before the trend continues its journey. They can be both bearish and bullish, with the former showing a continuation of a downtrend and the latter showing a continuation of an uptrend. In addition, some continuation patterns, such as wedges, can show reversals of a trend, while others, such as triangles, are bilateral chart patterns that show that an asset’s price can break out in either direction.
Оцените изложенный материал